5K Pace Chart: Mile & Km Splits, Cadence & Music BPM
Alex Chen, Certified Running Coach
September 10, 2026
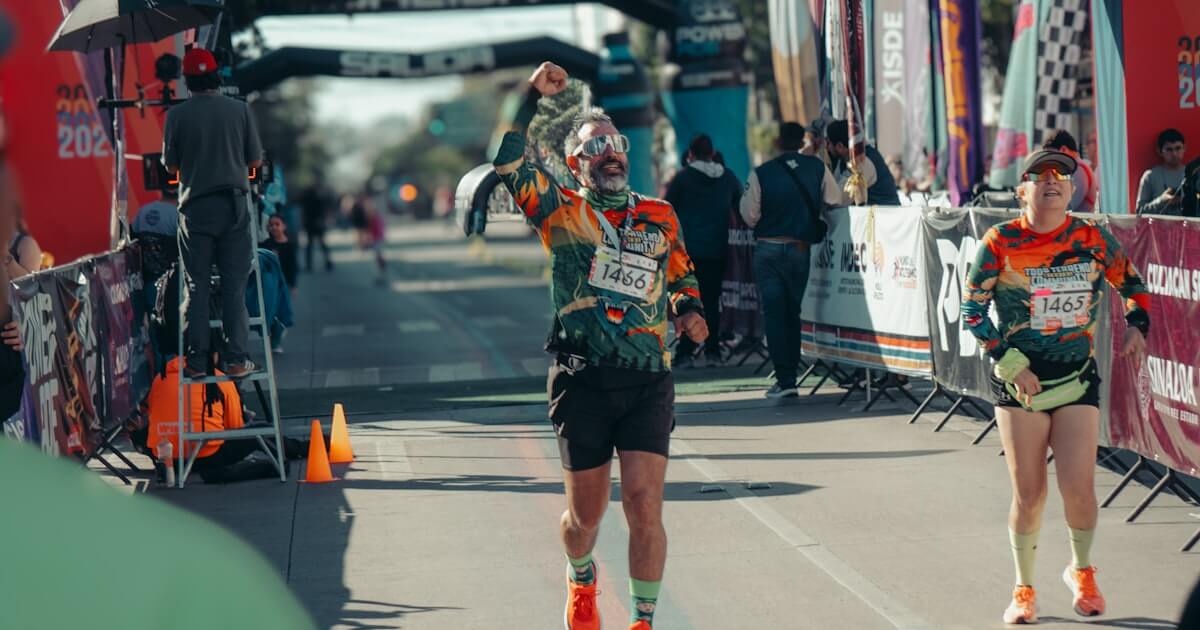
To run a 25:00 5K (3.107 miles / 5.0 kilometers), you need an exact pace of 8:03 per mile or 5:00 per kilometer. Breaking 20:00 requires 6:26 per mile (4:00 per kilometer), while finishing under 30:00 demands 9:39 per mile (6:00 per kilometer).
The master pace chart below details your exact mile splits, kilometer splits, 400-meter track lap times, treadmill speeds, and the cadence and music BPM targets needed to hold your rhythm when lactate surges in the second half.
Master 5K pace and split chart
A standard 5K measures exactly 5,000 meters, which equals 3.10686 miles (commonly rounded to 3.11 miles). The splits below assume an even-effort pace from the starting gun to the finish arch.
| Goal Finish Time | Mile Pace | Km Pace | 1 Mile Split | 2 Mile Split | 3 Mile Split | 400m Track Lap | Treadmill Speed | Target Cadence | Music BPM Lock |
|---|---|---|---|---|---|---|---|---|---|
| 15:00 | 4:50 /mi | 3:00 /km | 4:50 | 9:39 | 14:29 | 72 sec (1:12) | 12.4 mph (20.0 km/h) | 188–196 SPM | 188–196 BPM |
| 17:30 | 5:38 /mi | 3:30 /km | 5:38 | 11:16 | 16:54 | 84 sec (1:24) | 10.7 mph (17.1 km/h) | 184–192 SPM | 184–192 BPM |
| 20:00 | 6:26 /mi | 4:00 /km | 6:26 | 12:52 | 19:19 | 96 sec (1:36) | 9.3 mph (15.0 km/h) | 180–186 SPM | 180–186 BPM |
| 22:30 | 7:15 /mi | 4:30 /km | 7:15 | 14:29 | 21:44 | 108 sec (1:48) | 8.3 mph (13.3 km/h) | 176–182 SPM | 176–182 BPM |
| 25:00 | 8:03 /mi | 5:00 /km | 8:03 | 16:06 | 24:08 | 120 sec (2:00) | 7.5 mph (12.0 km/h) | 172–178 SPM | 172–178 BPM |
| 27:30 | 8:51 /mi | 5:30 /km | 8:51 | 17:42 | 26:33 | 132 sec (2:12) | 6.8 mph (10.9 km/h) | 168–174 SPM | 168–174 BPM |
| 30:00 | 9:39 /mi | 6:00 /km | 9:39 | 19:19 | 28:58 | 144 sec (2:24) | 6.2 mph (10.0 km/h) | 164–170 SPM | 164–170 BPM |
| 32:30 | 10:28 /mi | 6:30 /km | 10:28 | 20:55 | 31:23 | 156 sec (2:36) | 5.7 mph (9.2 km/h) | 160–166 SPM | 160–166 BPM |
| 35:00 | 11:16 /mi | 7:00 /km | 11:16 | 22:32 | 33:48 | 168 sec (2:48) | 5.3 mph (8.6 km/h) | 158–164 SPM | 158–164 BPM |
| 37:30 | 12:04 /mi | 7:30 /km | 12:04 | 24:08 | 36:13 | 180 sec (3:00) | 5.0 mph (8.0 km/h) | 154–160 SPM | 154–160 BPM |
| 40:00 | 12:52 /mi | 8:00 /km | 12:52 | 25:45 | 38:37 | 192 sec (3:12) | 4.7 mph (7.5 km/h) | 150–156 SPM | 150–156 BPM |
| 45:00 | 14:29 /mi | 9:00 /km | 14:29 | 28:58 | 43:27 | 216 sec (3:36) | 4.1 mph (6.7 km/h) | 146–152 SPM | 146–152 BPM |
Planning longer race distances? Cross-reference our 10K pace chart, our half marathon pace chart, or our full marathon pace chart to benchmark your pace fall-off across endurance distances.
The anatomy of a 5K: why Mile 2 decides the race
A marathon challenges your glycogen storage and mental endurance. A 5K, by contrast, is a battle against metabolic acidosis.
During a flat-out 5K, competitive runners operate at roughly 95% to 98% of maximum heart rate—well above the lactate threshold and hovering near VO2 max. When runners miss their target goal, the breakdown follows a predictable pattern:
1. The Mile 1 illusion
Adrenaline masks effort. Because your muscles still possess clean phosphocreatine and zero hydrogen ion backlog, running 15 to 20 seconds faster than race pace feels easy for the first 1,200 meters. But you cannot bank time in a 5K. Those banked seconds carry an exponential metabolic penalty.
2. The Mile 2 lactate surge
Between 1.5 miles and 2.5 miles (roughly kilometers 2.5 to 4.0), the honeymoon ends. Blood lactate concentrations climb rapidly. Breathing shifts from rhythmic to ragged, and stride turnover drops by 5 to 10 strides per minute. If you overcooked the opening mile, this is where your pace collapses by 30 to 60 seconds.
3. The final 1.1-mile mental grit
The final 1.1 miles (1.8 km) are purely neural and mechanical. Your legs feel wooden. You cannot lengthen your stride without spiking your braking force, so your only tool to maintain speed is keeping your step frequency fast and light.
Why cadence matters more at 5K pace than marathon pace
When running at marathon pace, runners can afford a relaxed turnover. At 5K pace, overstriding is catastrophic.
A landmark biomechanical study published in Medicine & Science in Sports & Exercise (Heiderscheit et al., 2011) showed that increasing running step rate by just 5% to 10% substantially reduces energy absorption at the knee and hip joints while shifting foot impact closer to the body's center of mass.
In a 5K, every millimeter your heel lands ahead of your knee acts as an active brake. Fast cadence (170–185 SPM depending on height and pace) minimizes ground contact time and relies on the stretch-shortening cycle of your Achilles tendon rather than raw muscular force.
| Running Metric | Low Cadence (152 SPM) | Optimal 5K Cadence (174 SPM) | Physiological Impact |
|---|---|---|---|
| Ground Contact Time | ~260–290 ms | ~210–235 ms | Less braking force per step |
| Vertical Oscillation | High (bouncy) | Compact & forward | Saves wasted vertical energy |
| Impact Loading on Knee | +15% to +20% higher | Absorbed by spring-mass system | Drastically lowers shin and patellar strain |
| Muscular Fatigue (Late Race) | Fast quad burnout | Distributed to tendon elastic recoil | Preserves closing kick |
Lock your 5K rhythm with BPM matching
When your lungs burn at mile 2.2, your brain tries to slow down your legs to survive. Watching your GPS watch every 10 seconds is counterproductive—GPS watch displays lag by 5 to 15 seconds, causing you to accelerate and decelerate erratically.
The most reliable way to lock your pace is auditory entrainment: matching your footstrikes directly to the beats of a song.
If your goal is a sub-25 5K (pace 8:03/mile, turnover ~174 SPM), listening to songs curated at exactly 174 BPM forces your feet to land on beat. Even when perceived exertion spikes, auditory pacing bypasses conscious decision-making and keeps your stride frequency pinned.
Trying to build and edit custom BPM playlists by hand in Spotify or Apple Music takes hours, and streaming algorithms often shift tempos mid-track.
GagaRun solves this by connecting directly to your Apple Music library, detecting the exact BPM of each track, and locking playback to your target step cadence. If you aim for 176 SPM, GagaRun plays only songs running at 176 BPM—keeping your turnover steady while you focus on breathing.

If you are following a structured time goal, check our dedicated training roadmaps:
- How to run a 5K under 20 minutes: Pace, plan & BPM
- How to run a 5K under 25 minutes: Pace, plan & BPM
- How to run a 5K under 30 minutes: Pace, plan & BPM
- Stepping onto the road for the first time? Follow our Couch to 5K playlist pacing guide
Pacing strategy: even split vs negative split
Running experts and exercise physiologists agree: the fastest way from start to finish in a 5K is an even split or a conservative negative split (running the second half slightly faster than the first).
The 51/49 pacing model
Aim to run the first 2.5 km in 50.5% to 51% of your total target time, and the second 2.5 km in 49% to 49.5%.
- For a 25:00 5K: Run the first mile in 8:08, mile two in 8:03, and mile three in 7:58, before kicking the final 0.1 mile.
- This prevents early acidosis, allows your aerobic enzymes to ramp up smoothly, and leaves you passing dozens of runners who sprinted off the line in the final kilometer.
Frequently asked questions
What is a good 5K finish time for a beginner?
For healthy adult beginners, finishing a 5K between 32:00 and 40:00 (approx. 10:20 to 12:50 per mile / 6:25 to 8:00 per km) is typical. Completing the full 3.1 miles without walking breaks represents a major aerobic milestone. Breaking 30:00 is widely considered the first major performance benchmark for recreational runners.
How many laps around a track is a 5K?
On a standard 400-meter outdoor track (running in Lane 1), a 5K is exactly 12.5 laps. If you run in Lane 2 or outer lanes without lane compensation, you run significantly farther (Lane 8 measures roughly 453 meters per lap).
Why do I always slow down in Mile 3 of a 5K?
You slow down because your blood lactate clearance threshold was breached in Mile 1. When hydrogen ions accumulate in the muscle tissue, contractile velocity drops and neuromuscular fatigue sets in. Starting just 10 seconds per mile slower in Mile 1 almost always fixes Mile 3 pace decay.
Should my 5K cadence be higher than my marathon cadence?
Yes. Stride rate increases naturally with running speed. Most recreational runners average 155 to 165 SPM during easy recovery runs and marathon pacing, but increase to 170 to 182 SPM during a 5K race effort.